2hives is independent and not affiliated with, endorsed by, or connected to Monroe Products or The Monroe Institute. Product names in this note are trademarks of their owners and are used only to refer factually to published works. Measurements describe acoustic structure only; no audio, script or booklet text is reproduced. Nothing here is a health claim.
Layered binaural-beat programmes: structure measured in a reference set and a reproducible synthesis method
2hives research note · 10 October 2026 · Version 1.0
Abstract
Commercial binaural-beat programmes are described in marketing or patent language, but their acoustic construction is rarely measured. We analysed a commercially published, multi-volume guided binaural programme with an open survey method. The method uses 16 s Hann windows stepped every 10 s at 11.025 kHz, which gives 0.0625 Hz resolution. Tone peaks must rise at least 18 dB above a local median and are refined by parabolic interpolation. Peaks are then paired across the ears and linked over time, and the noise spectrum, interaural coherence and speech activity are measured alongside.
We tracked 620 sustained binaural components (≥ 40 s). The main findings are:
- Layered beds. The bed is a stack of sine pairs, typically 2–3 at once in later volumes and up to 13 in one track.
- Carrier–beat ordering. Beat rises with carrier (Spearman ρ = 0.53): sub-1 Hz beats sit on ~50 Hz carriers, 1.5 Hz on 100 Hz, ~4 Hz on 200–400 Hz, and 7–10 Hz on 500–800 Hz.
- Level gradient. Component level falls 5.9 dB per octave of carrier.
- Dominant beat. 45% of main-body components beat at 3.5–4.25 Hz.
- Constant beats. Beats are held to within ±0.01 Hz/min. The exception is the first volume, where both carriers drift down.
- Noise. The noise slopes at −7.5 dB/octave. It is near-mono below 4 kHz in the first volume and fully independent between the ears in volumes II, V and VI, where it carries a 10 s level and brightness cycle.
- Wake-up block. Thirty-five of 36 tracks end with a louder block of beta- and gamma-range beats.
We built a bed-only synthesis engine from these measurements and tested it by re-surveying test renders of four reference tracks with the same tool. With measured noise shapes, 55 of 64 sustained components were recovered, with median beat errors ≤ 0.02 Hz and zero median timing error. The noise slope was matched to within 0.7 dB/octave. The first volume's band-limited interaural coherence was only partly reproduced (MSC 0.74 vs 0.89).
We relate the findings to the Monroe patents and to the mixed evidence on binaural-beat entrainment. No therapeutic claims are made.
1. Introduction
1.1 Binaural beats and the frequency-following response
When tones of slightly different frequency, f<sub>L</sub> and f<sub>R</sub>, reach the two ears separately, listeners perceive a fluctuation at |f<sub>R</sub> − f<sub>L</sub>|. The waveforms never mix acoustically, so this binaural beat is generated centrally, most likely in the superior olivary complex (Chaieb et al., 2015; Orozco Perez et al., 2020).
Oster (1973) summarised the classical psychophysics:
- The beat is clearest with carriers near 440 Hz and fades out near 1,000 Hz (other investigators report up to ~1,500 Hz).
- Below ~90 Hz the beat is easily confused with the tones themselves.
- It survives large level differences between the ears.
- It remains audible as a modulation of masking noise.
A monaural beat is different: two tones in the same ear mix physically into an amplitude modulation.
The auditory brainstem phase-locks to periodic sound. This yields a scalp-recordable frequency-following response (FFR) at the stimulus frequencies. At the beat frequency the cortex can show an auditory steady-state response (ASSR). Orozco Perez et al. (2020) recorded both from the same participants. Commercial use rests on a stronger entrainment hypothesis: that a sustained beat in a conventional EEG band shifts ongoing brain rhythms, and with them mental state. The evidence for that hypothesis is inconsistent (§7.2).
1.2 History and aims
R. A. Monroe patented audio methods for inducing sleep and "states of consciousness" between 1975 and 1994. The Monroe Institute's training programmes and its home-study recordings used the resulting binaural-beat process. Atwater (1997) described that process, and a 1983 US Army assessment, released by the CIA, analysed it (McDonnell, 1983).
Neither source gives carriers, beats, levels or noise parameters. As far as we know, none have been published for the distributed recordings. This note has three aims:
- Measure the stimulus bed of the recordings with an open, reproducible method.
- Specify an engine that synthesises beds with the same measurable structure.
- Validate the engine by re-measuring its output with the same tool.
2. Prior technical descriptions
US 3,884,218 (1975) predates binaural beats. It claims a "familiar, repetitive, pleasing sound" amplitude-modulated by a sleep-EEG-shaped signal and played above the ambient noise. The candidate sounds include rain, wind, waves upon a beach, breathing and a 500 Hz hum.
US 5,213,562 (1993) superimposes a "replicated EEG waveform" on two sets of stereo carriers so that it appears as interaural beat frequencies. Its worked example uses carriers of 100 Hz and 104 Hz (a 4 Hz beat). It allows "as many as 100 separate carrier pairs" and names 275 Hz as the "most effective harmonic carrier" for 4–5 Hz.
The same patent defines Phased Pink Sound as "relative rotational shifting of pink sound from one stereo audio channel to another with cyclic changes in amplitude, frequency, and rate of panning". It claims that, used at least 10 dB below the beat signals, this enhances the FFR by up to 30%. Its source code is a sinusoidally swept comb filter on noise, with delays of 60–80 samples and an 8 s cycle.
US 5,356,368 (1994) adds four elements:
- A Septon. Three binaural beats and two monaural beats per ear on a shared carrier ladder. In the example, the left ear has 200, 204 and 208 Hz and the right ear has 204, 208 and 212 Hz.
- Flanged noise. A comb-filter delay swept at "about 1/8 Hz", with an arbitrary left/right sweep phase.
- Stacked signal groups. A 90-min sequence of groups at fixed offsets (Group B 15 dB below A; noise and voice 10–20 dB below the leading group).
- A wake-up sequence. Beta-range signals or "a 400 Hz/416 Hz envelope" about 5 min before waking. Claim 15 specifies theta–alpha signals followed by beta–gamma signals.
Atwater (1997) describes binaural beats combined with restricted stimulation, verbal guidance, "pink sound" and natural sounds. He states that effective stimuli are "complex brain-wave-like patterns rather than simple sine waves" (his Figs. 1–2). He cites Oster's ~1,000 Hz carrier limit and the observation that noise enhances the beat. He gives no frequencies or levels.
McDonnell (1983) describes the frequencies as "played at a virtually subliminal, marginally audible level", sometimes "rolled in together with other sounds such as sea surf". He reports that "pink and white noise" enters at a later stage, and that later stages add "additional levels of sound".
Table 1 lists the construction claims that our data can test.
Table 1. Testable construction claims.
| # | Claim | Source |
|---|---|---|
| C1 | Low carriers; 100/104 Hz worked example | US 5,213,562 |
| C2 | Several carrier pairs at once ("complex" beat) | US 5,213,562; Atwater 1997 |
| C3 | Signal groups at fixed 10–20 dB offsets | US 5,356,368 |
| C4 | Septon ladder (3 binaural + 2 monaural beats per ear) | US 5,356,368 |
| C5 | Cyclic inter-ear "phased" noise, ~8 s | US 5,213,562; 5,356,368 |
| C6 | Noise ≥ 10 dB below the beat signals | US 5,213,562 |
| C7 | Surf-like amplitude-modulated sound | US 3,884,218; McDonnell 1983 |
| C8 | Tones at a marginally audible level | McDonnell 1983 |
| C9 | Beta/gamma wake-up block | US 5,356,368 |
3. Materials and methods
3.1 Reference material
The reference set is a commercially published guided programme of several volumes. Tracks last about 27–46 minutes and combine a spoken guide with a continuous bed of tones and noise.
No audio, script or booklet text is reproduced here.
Tracks were grouped into four stages, assigned from title and volume: Stage A (5 tracks), Stage B (19; volumes 2–4 plus the first track of volume 5), Stage C (5), Stage D (6), and one introductory track grouped with Stage A. These labels serve only as grouping variables.
3.2 Survey method
The survey tool uses the same analysis primitives that the engine uses to verify its own renders. Each track is decoded twice with ffmpeg to float stereo: once at 11.025 kHz for tones and once at 44.1 kHz for noise and voice. Analysis uses 16 s windows every 10 s, about 215 windows per track. Table 2 lists the parameters.
Table 2. Survey parameters.
| Stage | Rule |
|---|---|
| Tone spectrum | One Hann-windowed FFT per ear per window (176,400 points); bin spacing 0.0625 Hz; 20–1,500 Hz; amplitude-corrected so a full-scale sine reads 0 dBFS (peak) |
| Peak detection | ≥ 18 dB above a running median of the dB spectrum over 5 Hz; peaks ≥ 0.3 Hz apart; three-point parabolic interpolation for sub-bin frequency |
| Binaural pair | For each left tone, strongest first: nearest unused right tone with 0.25 ≤ |Δf| ≤ 45 Hz and level difference ≤ 6 dB. Rejected if the right tone also exists in the left ear (±0.25 Hz) |
| Monaural / diotic | Same-ear tones 0.25–45 Hz apart within 10 dB; same frequency in both ears (±0.15 Hz) |
| Component tracking | A detection joins the open component whose last left and right frequencies are within ±0.6 Hz and which was seen within 120 s. Components need ≥ 3 detections. Sustained means a span of ≥ 40 s. Glide is the least-squares slope in Hz/min for spans ≥ 60 s |
| Speech | Mid channel (L+R)/2, 300–3,400 Hz zero-phase band-pass; 50 ms RMS envelope. Speech when the 90th − 20th percentile spread is > 14 dB (syllable-rate modulation) and mid/side power in the band is > 6 dB |
| Noise (speech-free windows) | Welch PSD (8,192 points) in six octaves, 250 Hz–16 kHz; slope fitted over 500 Hz–16 kHz (dB/octave). Interaural magnitude-squared coherence (MSC, 4,096 points, 10.8 Hz resolution) averaged over 1–4 kHz and 4–10 kHz |
| Levels | Per-ear RMS. Bed = median over speech-free windows; voice = median over speech windows |
The 18 dB prominence test is relative to the local floor, so detection depends on the surrounding noise rather than on absolute level. With about 340 Welch segments per window, the MSC of independent signals has a bias floor of about 0.003 (Carter et al., 1973).
The survey report aggregates the 36 files. Components ending more than 240 s before the end of a track form the main body (338 components). Components starting in the last 300 s form the wake-up block. Beat bands are:
| Band | Range (Hz) |
|---|---|
| sub-delta | < 0.5 |
| delta | 0.5–< 4 |
| theta | 4–< 8 |
| alpha | 8–< 13 |
| beta | 13–< 30 |
| gamma | ≥ 30 |
The most common beat, 4.0 Hz, lies on the delta/theta edge, so we also report beats directly.
Supplementary measurements. The noise-cycle parameters in §4.7 come from envelope analysis of speech-free passages by the 2hives team (10 October 2026). They are reported as received.
3.3 Synthesis test procedure
A synthesis tool turns a reference survey into a bed-only template (no voice):
- Tone tracks. Each sustained component becomes a tone track with the same start and end times and the same first and last left/right frequencies, glided linearly. Its level is the first and last value if these differ by more than 3 dB, otherwise the median. Fades are 8 s.
- Noise level. Bed RMS minus the power of the tones active at mid-programme.
- Noise character. The noise spectrum is measured from the reference with an analysis tool (Welch PSD of speech-free windows, median-filtered over ⅓ octave to remove tones, sampled at ⅙-octave points). Interaural correlation and cycle settings are set per volume (Table 9).
Templates are rendered without loudness normalisation and then surveyed. A comparison tool matches each sustained reference component to a test-render component that overlaps it in time, with left and right start frequencies within 0.15 Hz. It reports beat, level and timing errors and the noise metrics.
4. Results
4.1 Overview
Table 3. Per-volume medians (six tracks each).
| Volume | Speech windows | Bed RMS (dBFS) | Sustained components / track | Noise slope (dB/oct) | MSC 1–4 kHz | MSC 4–10 kHz |
|---|---|---|---|---|---|---|
| Volume 1 | 17% | −35.0 | 10 | −7.8 | 0.90 | 0.20 |
| Volume 2 | 26% | −31.5 | 12 | −6.1 | 0.003 | 0.004 |
| Volume 3 | 10% | −38.5 | 13.5 | −9.4 | 0.71 | 0.07 |
| Volume 4 | 11% | −41.0 | 19.5 | −7.2 | 0.48 | 0.07 |
| Volume 5 | 14% | −35.7 | 20.5 | −8.9 | 0.003 | 0.007 |
| Volume 6 | 10% | −33.6 | 19 | −6.4 | 0.004 | 0.014 |
| All | 14% | −34.5 | — | −7.5 | — | — |
We tracked 620 sustained components. Their median span was 136 s (90th percentile 1,146 s), and 96 lasted at least 10 min.
4.2 Carriers
Carrier centres ((f<sub>L</sub> + f<sub>R</sub>)/2) cluster on round values (Table 4). All lie at or below ~1,000 Hz, the limit given by Oster (1973), and only 1% are near it. The 100/104 Hz pair of US 5,213,562 occurs exactly and dominates volume 1.
Outside volume 1, frequencies recur across tracks to within 0.01 Hz (e.g. 495.00/505.00, 99.25/100.75 and 467.00/483.00 Hz). This points to a fixed library of digitally generated tones.
Table 4. Carrier centres of sustained components (25 Hz bins, top 12 of 620).
| Centre (Hz) | n | Centre (Hz) | n |
|---|---|---|---|
| 500 | 78 | 200 | 35 |
| 600 | 67 | 250 | 19 |
| 100 | 65 | 475 | 19 |
| 50 | 55 | 800 | 16 |
| 400 | 52 | 275 | 15 |
| 300 | 46 | 350 | 12 |
4.3 Beats by stage
Table 5. Main-body beats by stage (counts; wake-up block excluded).
| Stage | n | sub-δ | δ | θ | α | β | γ | Most common beats, Hz (count) | Typical pairs (Hz) |
|---|---|---|---|---|---|---|---|---|---|
| Stage A | 27 | 0 | 14 | 7 | 4 | 2 | 0 | 3.75 (11), 4.0 (5) | 100/104, 298/302 |
| Stage B | 162 | 3 | 85 | 61 | 10 | 2 | 1 | 4.0 (42), 3.75 (25), 3.5 (23), 4.25 (14), 0.75 (8) | 50/50.5, 99/103, 401/397 |
| Stage C | 68 | 1 | 28 | 20 | 18 | 0 | 1 | 10.0 (17), 1.5 (14), 7.25 (12), 0.75 (8), 4.0 (8) | 595/605, 495/505, 99.25/100.75 |
| Stage D | 78 | 0 | 28 | 32 | 9 | 9 | 0 | 4.0 (22), 7.25 (11), 1.5 (10), 2.0 (8), 16.0 (6) | 248/252, 298/302, 38/36 |
| All | 338 | 4 | 158 | 120 | 41 | 13 | 2 | 4.0 (77), 3.75 (38), 10.0 (30), 1.5 (27), 7.25 (25) | — |
Across the main body, 153 of 338 components (45%) beat at 3.5–4.25 Hz. The stages differ mainly in what is layered around this core (Figs. 1–2):
- Stage A: a 3.75–4 Hz bed on 100 Hz and 300 Hz carriers, with brief alpha and beta components.
- Stage B: adds a 50 Hz cluster with 0.5–0.75 Hz beats.
- Stage C: adds an alpha layer (10 Hz on 495/505 and 595/605 Hz; 7.25 Hz on 504/511, 607/599 and 807/800 Hz) above a 1.5 Hz pair at 99.25/100.75 Hz.
- Stage D: combines these layers, adds a 2.12 Hz pair at 36/38 Hz, and adds some 16 Hz components.
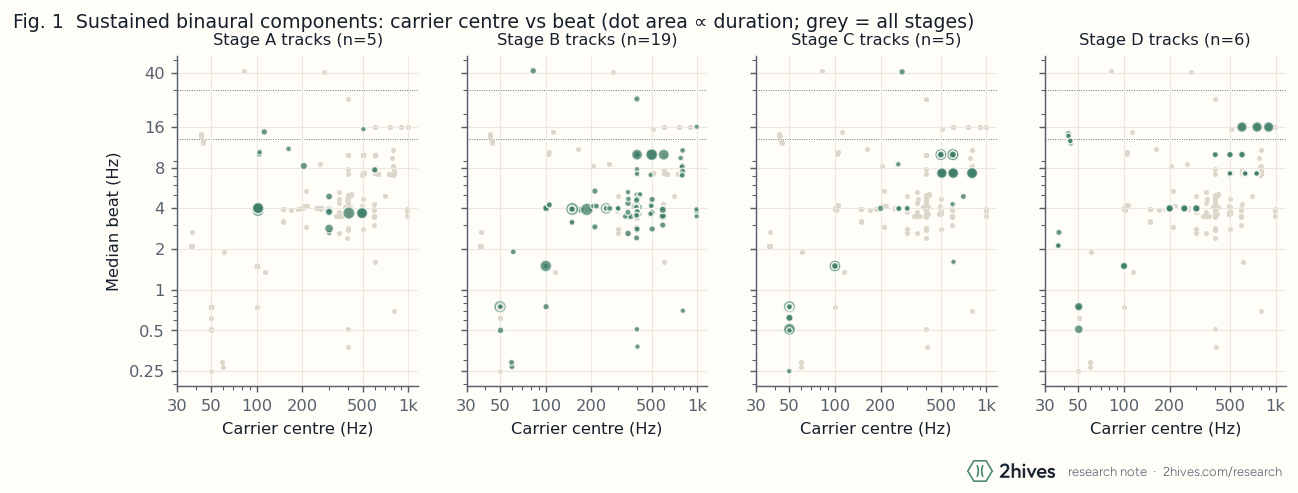
Figure 1. Carrier centre vs median beat of main-body components by stage (blue) against all stages (grey). Dot area is proportional to duration; dotted lines mark band edges.
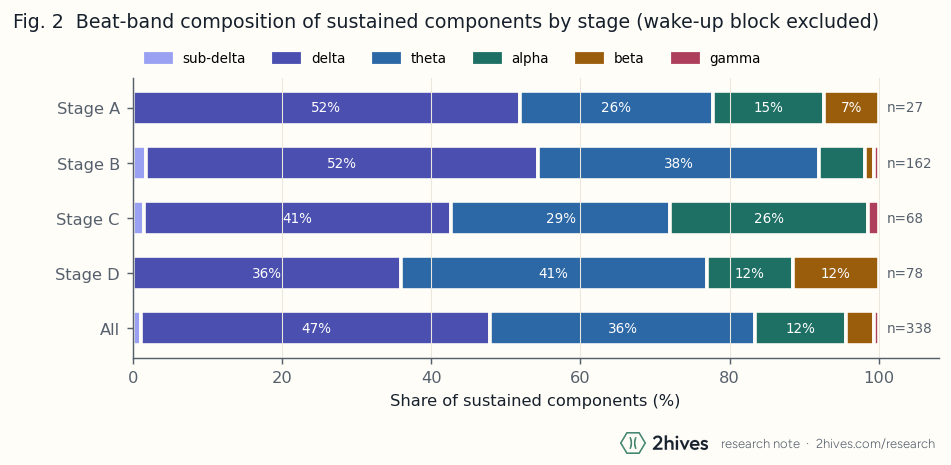
Figure 2. Beat-band shares of main-body components by stage.
4.4 Stacking: carrier order, simultaneity and level
Carrier order. Beat rises with carrier frequency (Spearman ρ = 0.53, n = 620; Table 6). Each stack puts its slowest beat on its lowest carrier. For example, the Stage D-type track in Fig. 3 combines:
| Carrier (Hz) | Beat (Hz) |
|---|---|
| 50 | 0.5–0.75 |
| 100 | 1.5 |
| 200, 250, 300 | 4 |
| 400, 500, 600 | 10 |
Table 6. Beat and level by carrier band (620 sustained components).
| Carrier (Hz) | n | Median beat (Hz) | Beat p10–p90 (Hz) | Median level (dBFS peak) |
|---|---|---|---|---|
| < 75 | 65 | 0.75 | 0.5–5.4 | −41.6 |
| 75–150 | 82 | 1.6 | 1.5–10.3 | −42.5 |
| 150–250 | 57 | 4.0 | 4.0–13.7 | −51.5 |
| 250–350 | 83 | 4.0 | 3.7–15.2 | −54.4 |
| 350–450 | 68 | 4.3 | 3.3–15.3 | −56.8 |
| 450–550 | 101 | 10.0 | 3.7–16.0 | −52.2 |
| 550–700 | 79 | 10.0 | 3.5–40.0 | −61.8 |
| 700–1,100 | 69 | 7.3 | 3.3–30.6 | −82.8 |
Simultaneity. We counted the sustained main-body components active at each window centre:
| Volume | Median | 90th pct. | Max | Share of windows with ≥ 2 |
|---|---|---|---|---|
| Volume 1 | 1 | 4 | 6 | 39% |
| Volume 2 | 1 | 2 | 3 | 12% |
| Volume 3 | 0 | 4 | 13 | 18% |
| Volume 4 | 1 | 3 | 11 | 40% |
| Volume 5 | 3 | 4 | 7 | 78% |
| Volume 6 | 2 | 5 | 8 | 59% |
Low medians in volumes 2–4 partly reflect stretches where no tone clears the 18 dB prominence test under speech or loud noise. The "complex binaural beat" (C2) is therefore realised as a stack of separate sine pairs on harmonically related carriers, not as one non-sinusoidal waveform on a single carrier.
Level. Main-body tone levels have a 10th/50th/90th percentile of −69.8/−53.5/−38.0 dBFS (peak). Level falls 5.9 dB per octave of carrier (n = 338; ρ = −0.69; Fig. 4), so the 50–100 Hz components lead. Within a window, the strongest pair exceeds the next by a median of 2–7 dB, depending on volume.
This continuous gradient differs from the discrete 10–20 dB groups of C3. The median tone is about 16 dB below the bed RMS in broadband power, which fits "marginally audible" in relative terms (C8). However, it means the noise dominates the bed, the reverse of C6.
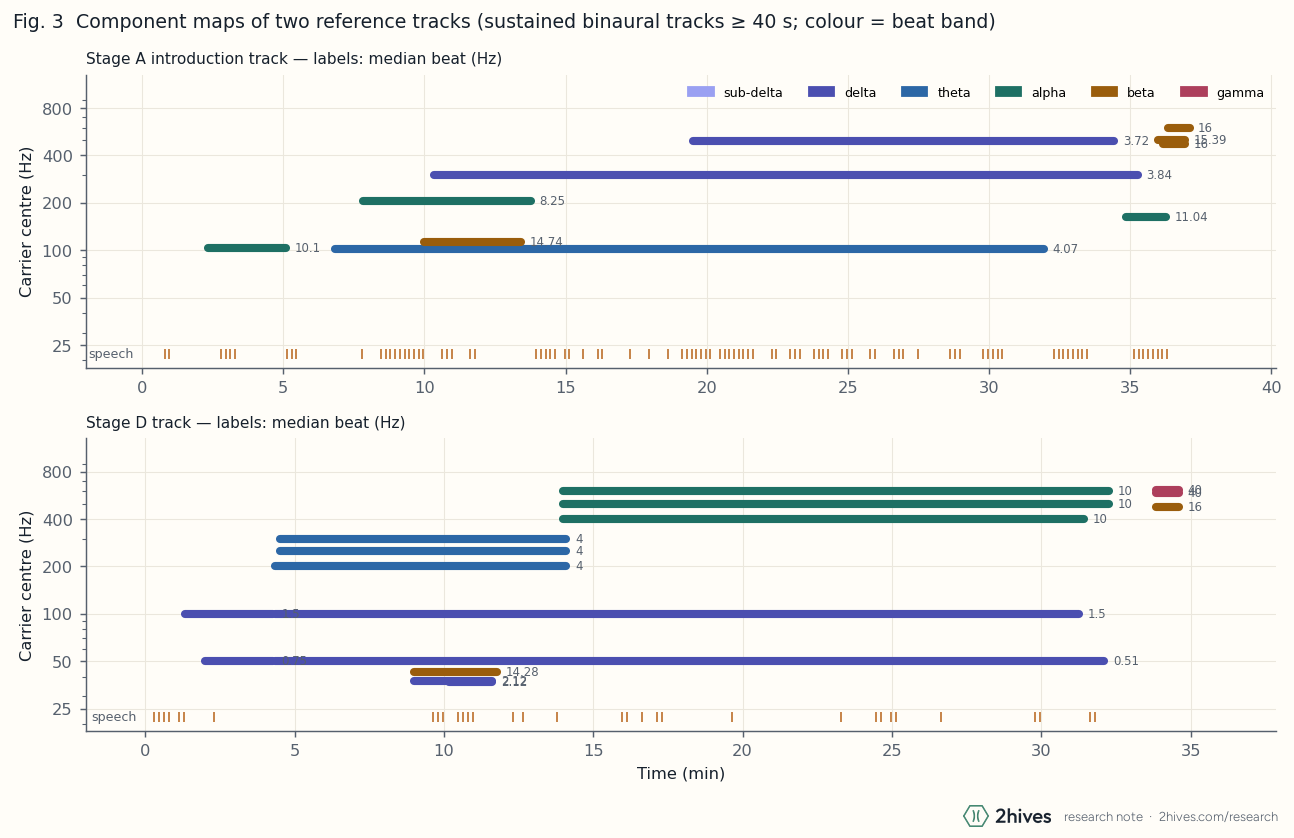
Figure 3. Component maps of a Stage A-type (top) and a Stage D-type (bottom) track. Bars mark sustained components at their carrier centre, coloured by band and labelled with the median beat. Ticks mark speech windows.
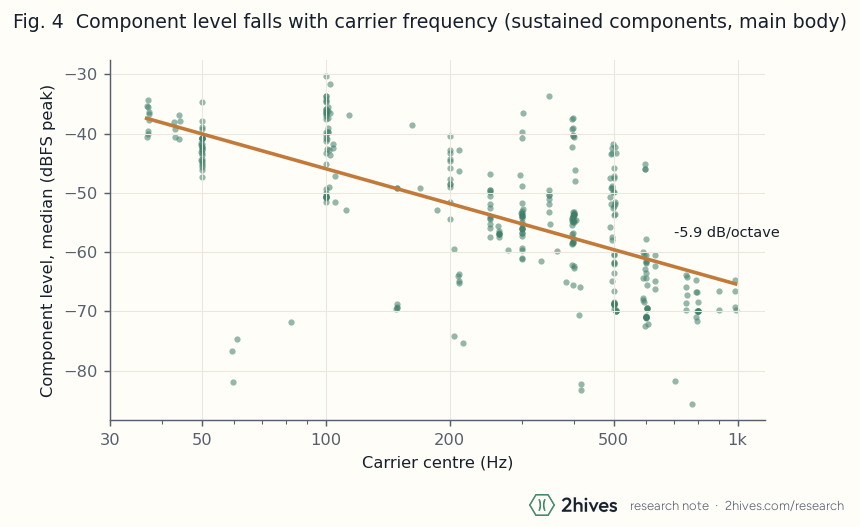
Figure 4. Component level vs carrier centre (main body) with a log-frequency least-squares fit.
4.5 Ear orientation and glides
Orientation. The higher carrier is in the right ear in 356 of 620 components (57.4%; binomial p = 0.0003, which overstates the evidence because components are not independent). The same pair often appears in both orientations within a track; for example, 99.25/100.75 and 100.75/99.25 Hz occur 13 times each.
Glides. Beats are held almost constant. Across the 155 components lasting at least 5 min, the beat glide percentiles are:
| Percentile | Beat glide (Hz/min) |
|---|---|
| 5th | −0.011 |
| 50th | 0.000 |
| 95th | +0.004 |
Volume 1 is the exception. Both carriers of its long 100/104 Hz and 298/302 Hz components fall by 0.01–0.04 Hz/min, and the beat falls by about 0.01 Hz/min. Examples are 4.08 → 3.87 Hz over 25 min (100.27/104.35 → 99.84/103.71 Hz) and 4.10 → 3.86 Hz over 29 min. The 2hives team independently measured 4.13 → 3.89 Hz over ~25 min.
The two carriers fall by different fractions (−0.43% and −0.61%), so the drift is not a playback-speed error. It could be either a deliberate sweep or free-running analogue oscillators; the data cannot tell these apart. Level paths are similarly flat: the median slope is −0.015 dB/min (10th–90th percentile −0.40 to +0.14).
4.6 Monaural and diotic structure
No strict Septon ladder (C4) was found in 6,334 speech-free windows. We searched for a left tone f, a shared tone f + d and a right tone f + 2d, with d equal to the binaural beat. Several related clusters do mix binaural and monaural beats:
- 50 Hz cluster (volumes 2, 4–6). The left ear carries 49.75 + 50.0 Hz and the right ear 50.0 + 50.5 Hz. This gives 0.5–0.75 Hz binaural beats and 0.25–0.5 Hz monaural beats, with 50.0 Hz diotic. The tracker sometimes swaps partners inside this cluster, so apparent 0.75 → 0.25 Hz "glides" here are pairing changes, not sweeps.
- 36/38 Hz pair (volume 6). The left ear carries 37.84 + 38.38 Hz and the right ear 35.72 + 36.26 Hz, giving a 2.12 Hz binaural beat and a 0.54 Hz monaural beat in each ear.
- Wake-up doublets. The left ear carries 568 + 592 Hz and the right ear 608 + 632 Hz, giving two 40 Hz binaural beats over a 24 Hz monaural beat in each ear (§4.9).
Diotic tones near 60, 120 and 180 Hz in volumes 1, 3 and 4 are most likely mains hum from production, not designed content.
4.7 Noise: spectrum, coherence and the phased cycle
Spectrum. Speech-free noise falls at a median −7.5 dB/octave (500 Hz–16 kHz). That is steeper than pink (−3 dB/octave) and close to brown (−6 dB/octave), so "pink sound" in the patents should be read loosely. The decorrelated volumes have 8–12 dB less energy at 0.5–4 kHz, relative to the 250–500 Hz octave, than volume 1 (Fig. 5).
Coherence. The volumes fall into three regimes:
- Volume 1: near-mono and steady. MSC is about 0.89 at 1–4 kHz and 0.18 at 4–10 kHz, so the ears share almost all noise below ~4 kHz.
- Volumes 2, 5 and 6: independent. MSC is 0.003–0.014, the estimator floor, so each ear receives independent noise.
- Volumes 3 and 4: mixed. Track medians range from 0.003 to 0.93.
Cycle. From volume 2 onward the noise carries a 10.0 s cycle (supplementary measurements; Table 7).
Table 7. Noise modulation variants.
| Variant | Where | Per-ear level swing | Interaural phase | Spectral effect |
|---|---|---|---|---|
| Steady | Volume 1 | none | — | none |
| Swell | Stage B introduction (volume 2) | both ears together, up to ≈ 10 dB p-p in 1.5–8 kHz | ≈ 0° | surf-like brightening |
| Rotation | Stage C/Stage D-type tracks | ±0.8 dB, sinusoidal | right ear ≈ 90° ahead | 1–10 kHz centroid ±235 Hz |
The rotation variant matches the patents' phased pink sound (C5): a quadrature level rotation between the ears with a spectral sweep, as a swept comb filter would produce. Its 10.0 s period is longer than the patents' 8 s and "about 1/8 Hz". The swell variant matches the surf-like modulated sound of US 3,884,218 and McDonnell (1983) (C7).
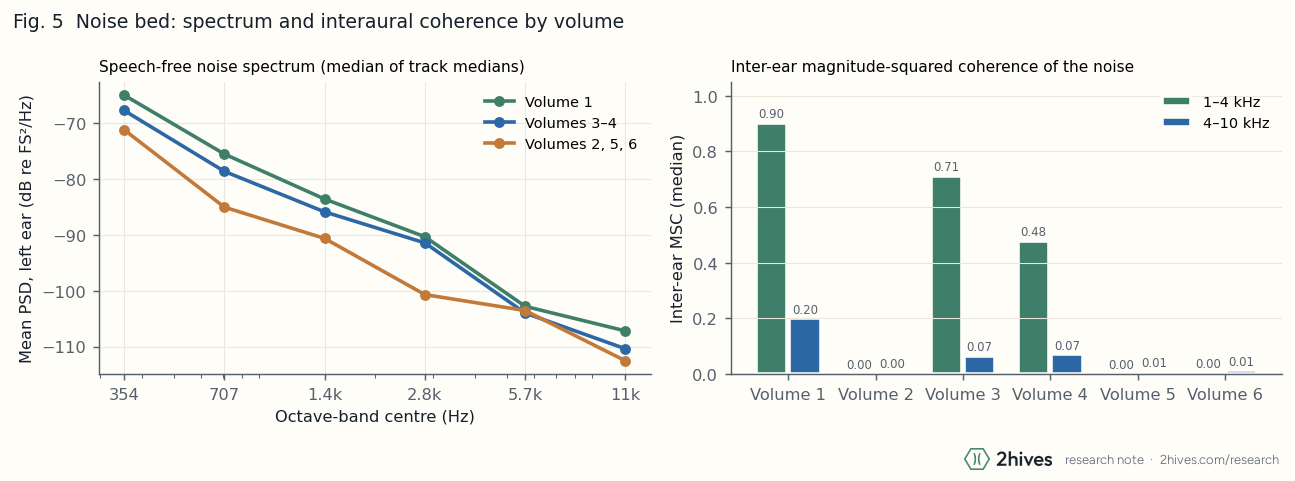
Figure 5. Left: octave-band noise PSD (left ear, speech-free) for three groups of volumes. Right: median interaural MSC per volume; ≈ 0.003 is the floor for independent signals.
4.8 Voice relative to bed
Across the 31 tracks with speech, speech windows are a median 3.8 dB louder than speech-free windows (10th–90th percentile 1.5–10.8 dB). The figure falls steadily across the series. The implied voice-alone level relative to the bed, obtained by subtracting bed power, falls with it:
| Volume | Speech − bed (dB) | Implied voice re bed (dB) |
|---|---|---|
| Volume 1 | 10.1 | +9.6 |
| Volume 3 | 7.0 | +6.0 |
| Volume 4 | 6.1 | +4.8 |
| Volume 2 | 3.4 | +0.8 |
| Volume 5 | 2.8 | −0.4 |
| Volume 6 | 1.5 | −4.0 |
The guide is clearly in front of the bed in the first volume and at or below the bed's broadband power in the last.
4.9 Wake-up signature
In 35 of 36 tracks, new components start within the final 300 s, a median 2.2 min before the end (range 0.8–4.8 min). Of these tracks:
- 33 contain beta beats, usually 15–16 Hz (77 components).
- 20 contain gamma beats.
- 19 contain beats of 30–40 Hz, most often exactly 40 Hz (25 components).
The loudest wake-up component in each track has a median level of −33.8 dBFS (10th–90th percentile −45.7 to −24.0), above the main-body 90th percentile of −38.0 dBFS. These components can rise about 20 dB in under a minute.
Typical stacks include 467/483 Hz (16 Hz) with 568/608 and 592/632 Hz (40 Hz), and octave-doubled pairs such as 491.6/506.9 Hz (15.3 Hz) with 983.2/1,013.7 Hz (30.5 Hz). The theta/alpha-then-beta/gamma order of US 5,356,368 claim 15 appears in several tracks (C9).
4.10 Prior claims against the measurements
Table 8. Status of the claims in Table 1.
| # | Claim | Finding |
|---|---|---|
| C1 | Low carriers; 100/104 Hz | Supported: 100/104 Hz dominant in volume 1; all carriers ≤ ~1 kHz |
| C2 | Several pairs at once | Supported: median 2–3 in later volumes, up to 13; carrier-ordered stacks |
| C3 | Fixed 10–20 dB group offsets | Not as stated: continuous −5.9 dB/octave gradient |
| C4 | Septon ladder | Not found: related binaural + monaural clusters exist |
| C5 | Phased noise, ~8 s | Supported in form: 10.0 s quadrature rotation with spectral sweep |
| C6 | Noise ≥ 10 dB below tones | Reversed: noise dominates bed power |
| C7 | Surf-like modulation | Supported: ~10 dB co-phased swell in the Stage B introduction |
| C8 | Marginally audible tones | Consistent (relative): median tone ≈ 16 dB below bed RMS |
| C9 | Beta/gamma wake-up | Supported: 35/36 tracks, louder than the body |
5. Synthesis method
The 2hives engine renders a programme from a JSON template and a script. The voice is synthesised separately and mixed at −22 dBFS active-speech RMS. Only the bed is described here.
Timeline. A template is a list of phases. Each phase is either fixed-length (intro, return) or weighted to share the remaining time, so a programme stretches without moving its fixed sections. Script lines keep their offset within fixed phases and their relative position within stretching ones.
Adjacent phases are joined by complementary raised-cosine crossfades whose gains sum to 1, and the programme has 8 s fades at each end. A pair shared by adjacent phases is a single oscillator, so it passes through the boundary without a phase reset.
Tones. Two forms cover everything measured in §4:
- Phase pairs: (f<sub>L</sub>, f<sub>R</sub>, level) triples attached to phases.
- Tracks: pairs with their own start and end times, linear frequency glides, linear-in-dB level ramps and raised-cosine fades.
Together these cover stacks at any carriers, both ear orientations, sub-hertz and constant or gliding beats, monaural doublets (two tracks in one ear) and level ramps.
All oscillators are computed from absolute time, and a glide's phase is the exact integral 2π(f<sub>0</sub>u + ½ku²). Output is therefore bit-identical for any chunk size, which a unit test checks. Starting phases are a hash of the pair's frequencies, so renders are deterministic.
Noise. Three independent, seeded noise streams are generated (left, right, common). They are spectrally shaped in one of two ways:
- Fixed chain: a one-pole integrator (−6 dB/octave above ~40 Hz), a 3 kHz first-order low-pass and a 25 Hz high-pass.
- Measured shape (
noise_shape, added during this study): an 8,191-tap linear-phase FIR fitted to a target spectrum, applied by overlap-add with its state carried across chunks.
Each phase sets the following, and values are blended across crossfades by the phase gains:
noise_db: RMS per ear.noise_corr(c): shared power. Each ear receives √(1−c)·own + √c·common. Withnoise_corr_below_hz, a 4th-order Linkwitz–Riley crossover shares only the low band and keeps each ear's own high band; the two bands sum flat.mod_depth_dbandmod_pan_deg: a sinusoidal per-ear level cycle of ±depth dB overnoise_period_s(default 10 s), with the right ear offset by the pan angle. 0° gives a swell, 90° a rotation.sweep: a 2 kHz high-passed copy of the noise added in phase with each ear's cycle, so brightness follows level.
Table 9. Noise settings used for test renders.
| Volume | noise_corr |
Shared below | mod_depth_db |
mod_pan_deg |
sweep |
|---|---|---|---|---|---|
| I | 0.98 | 4 kHz | 0 | 0 | 0 |
| II | 0 | — | 2.5 | 0 | 0.15 |
| III–VI | 0 | — | 0.8 | 90 | 0.15 |
Mastering and self-description. One static gain normalises the master to −24 LUFS (ITU-R BS.1770), capped so the true peak stays at or below −3 dBTP. The master is then encoded to 24-bit FLAC and AAC, with chapters at phase boundaries.
Each render also writes a spec sheet (describe.py). The design part lists every pair and track (beat, band, carrier, higher ear, glide, level), the noise settings and the voice clips. The measured part re-analyses a speech-free 16 s window in the middle of each phase with the §3.2 primitives. The code that characterised the reference set therefore checks every output file.
6. Synthesis validation
6.1 Design
We rendered test versions of four reference tracks, one per stage and noise regime:
- the Stage A introduction (volume 1; near-mono noise)
- the Stage B introduction (volume 2; swell)
- a Stage C introduction (volume 5; rotation)
- a Stage D introduction (volume 6; rotation)
The templates held 10, 5, 25 and 24 tone tracks. They were rendered at 48 kHz without normalisation, surveyed with the unchanged tool, and compared. Test renders are internal test material and are not distributed.
The engine was revised during the study, so two runs are reported:
- Run A (22:34 AEDT, 10 October 2026): the fixed noise chain.
- Run B (22:40–22:44 AEDT): measured noise shapes, the Linkwitz–Riley split, and
noise_corr0.98 for volume 1.
6.2 Results
Table 10. Test render vs reference, measured with the same survey tool (Run B; Run A in brackets where different).
| Metric | Stage A (volume 1) | Stage B (volume 2) | Stage C (volume 5) | Stage D (volume 6) |
|---|---|---|---|---|
| Sustained reference components | 10 | 5 | 25 | 24 |
| Matched | 7 [10] | 5 [5] | 20 [14] | 23 [14] |
| Extra in test render | 0 | 0 | 1 | 0 |
| Beat error, median / max (Hz) | 0.02 / 0.09 | 0.01 / 0.01 | 0.00 / 0.24 | 0.00 / 0.25 |
| Level error, median / max |dB| | 1.1 / 6.8 [0.85 / 18.1] | 1.3 / 3.7 [0.8 / 3.9] | 1.65 / 8.6 [4.5 / 8.7] | 0.2 / 9.1 [0.15 / 2.2] |
| Start / end timing error, median (s) | 0 / 0 | 0 / 0 | 0 / 0 | 0 / 0 |
| Noise slope, ref → test render (dB/oct) | −7.4 → −7.2 [−9.0] | −7.7 → −8.4 [−8.8] | −8.9 → −8.9 | −6.2 → −6.3 [−8.8] |
| Octave-band PSD error, 0.5–4 kHz (dB) | +3.0 to +4.2 | +0.7 to +3.8 | +2.4 to +5.0 [+10 to +14] | +0.6 to +1.7 [+11 to +13] |
| MSC 1–4 kHz, ref → test render | 0.887 → 0.74 [0.17] | 0.003 → 0.004 | 0.003 → 0.003 | 0.004 → 0.003 |
| MSC 4–10 kHz, ref → test render | 0.177 → 0.015 | 0.004 → 0.004 | 0.007 → 0.003 | 0.014 → 0.003 |
| Bed RMS, ref → test render (dBFS) | −33.2 → −34.8 [−37.3] | −32.0 → −31.3 | −36.0 → −36.0 | −33.5 → −33.5 |
In Run B, 55 of 64 sustained reference components were recovered (86%), up from 43 of 64 (67%) in Run A. Beat errors stayed within the analysis bin, median timing errors were zero, and broadband bed level matched to within 1.6 dB.
Measuring the noise shape had a large effect on Stage C and Stage D. In Run A, the fixed chain put 10–14 dB too much energy into 0.5–4 kHz, and weak 400–800 Hz tones at −56 to −72 dBFS fell below the 18 dB prominence test. Matching the spectrum restored most of them and corrected the noise slope to within 0.7 dB/octave.
6.3 Remaining discrepancies
- Stage A lost three components in Run B. These are 200.4/208.6 Hz (−59 dBFS), 119.5/104.8 Hz (−53 dBFS) and a 46 s wake-up pair. The noise estimate rose from −40.2 to −35.9 dBFS, and the test render's 0.5–4 kHz octaves are now 3–4 dB above the reference. That is enough to mask weak tones near the prominence threshold. The noise-level estimate and the tone-detection margin interact, and neither run reproduced both perfectly.
- Volume 1 coherence is only partly reproduced. The test render gives 0.74 instead of 0.89 at 1–4 kHz, and 0.015 instead of 0.18 at 4–10 kHz. A crossover at exactly 4 kHz lowers sharing toward the top of the lower band and removes it above. The reference evidently shares some noise above 4 kHz as well. A higher crossover, or partial correlation in the high band, should close the gap.
- Level paths. The maximum level errors of 7–9 dB come from short wake-up components that rise 20–30 dB within a minute, and from long components with rise-and-fall level paths. The test rendertor models both with only two points (first and last). The engine can represent such paths, but the test rendertor does not yet extract them.
- Tracker artefacts. One "extra" Stage C component (594.99/599.29 Hz) and the missed 50 Hz-cluster components come from partner exchange between overlapping, closely spaced pairs (§4.6), in the reference survey, the test-render survey or both. They are not synthesis errors.
- Not yet validated. The 10 s cycle (period, depth, interaural phase, centroid sweep) is not measured by the survey tool. It is implemented as in Table 9 but has not been verified against the references.
In summary, the engine reproduces the tone layer (carriers, beats, glides, timing, orientation and stacking) within measurement resolution. It reproduces the noise layer in broadband level, spectral slope and, for the later volumes, interaural independence. It does not yet fully reproduce the first volume's band-limited correlation or fast level envelopes.
7. Discussion
7.1 Relation to the patents
The recordings implement the main ideas of the Monroe patents in a simpler, measurable form:
- Complex beat as a stack. The "replicated EEG waveform" appears as a stack of a few sine pairs on harmonically related carriers (50, 100, 200–300 and 400–800 Hz), with each pair beating in a different conventional band and the slowest beat on the lowest carrier.
- Level gradient. Levels follow a gradient that favours the slow, low components, not discrete signal groups.
- Phased noise. The phased noise matches the patents' description: a slow quadrature rotation between the ears with a spectral sweep. Its period is 10 s rather than 8 s.
- Wake-up. The beta/gamma wake-up described for the sleep processor appears in almost every track, often with 40 Hz beats.
- No strict Septon. The Septon ladder was not observed, but sub-hertz clusters and wake-up doublets do combine binaural and monaural beats.
There are two main departures. First, the noise, not the tones, carries most of the bed's power. Second, volume 1 differs in kind from the rest: near-mono steady noise, a guiding voice ~10 dB above the bed, and drifting carriers. These are consistent with different production methods for the earliest material, but the data cannot establish this.
7.2 The evidence base
This study measures a stimulus, not its effects, and the experimental literature on effects is mixed:
- Ingendoh et al. (2023) reviewed 14 EEG studies. Five were consistent with entrainment, eight contradicted it and one was mixed. The authors attribute much of this to heterogeneous stimuli and analyses.
- Orozco Perez et al. (2020) found that binaural beats evoke an FFR and a cortical ASSR. Monaural control beats entrained the cortex more strongly, and neither changed mood.
- Chaieb et al. (2015) review contradictory findings for cognition and mood and stress the importance of stimulus parameters.
- A meta-analysis reports effects on anxiety, cognition and pain perception, moderated by exposure and task (Garcia-Argibay et al., 2019; cited from abstract).
- McConnell et al. (2014; n = 21) found greater self-reported relaxation and HRV changes during theta beats after exercise, compared with carrier tones alone. The HRV differences had disappeared by the end of the session.
- Sudre et al. (2024) found that panning sounds and alternating beeps affected EEG and relaxation as much as binaural beats. They attribute the effect to spatial movement, not to beating.
The last finding bears directly on these programmes. They also contain:
- a slowly rotating noise image
- surf-like swells
- a guiding voice
- long periods of restricted stimulation
- expectancy created by the programme's framing
Each of these could plausibly change arousal or relaxation on its own. Moreover, the most prominent tones are the 50–100 Hz carriers with 0.5–1.5 Hz beats, a range where, according to Oster (1973), beats are hard to separate from the tones themselves.
Studies of such programmes should therefore compare four conditions:
- matched diotic carriers (no beat)
- monaural-beat equivalents
- noise-only and voice-only beds
- rotating vs static decorrelated noise
The engine described here can generate all of these from a single template.
7.3 Use
For 2hives these measurements are engineering targets: which carrier and beat combinations, levels, noise treatments and timings a layered programme uses. They are not therapeutic specifications. 2hives programmes use original templates, scripts and voices. They reuse no reference audio or text and do not use the source's names.
8. Limitations
- Detection. Detection requires 18 dB prominence in a 16 s window. Weak tones under loud noise or speech are missed, and components shorter than three detections (~36 s) are discarded.
- Pairing. Greedy nearest-frequency pairing with ±0.6 Hz linking is ambiguous in dense clusters (35.7–38.4 Hz; 49.75–50.5 Hz). One 14.3 Hz cross-cluster pair is probably an artefact.
- Level reference. Levels are relative to digital full scale. The listener's presentation level, which governs audibility, is unknown.
- Speech and voice levels. The speech detector is heuristic, and voice levels include the bed underneath.
- Noise statistics. Octave levels are from the left ear only. Coherence is a 16 s average and does not resolve the 10 s cycle, whose parameters come from supplementary measurements.
- Stage labels. Stage labels come from titles and volume membership, and the Stage B group is heterogeneous.
- Test-render scope. Only four bed-only test renders were made, while the engine was being revised. Volume 1 coherence and the noise cycle are not yet validated.
- Edition. Only one digital edition was analysed.
- No listener data. No perceptual or physiological data were collected.
References
Atwater, F. H. (1997). Accessing anomalous states of consciousness with a binaural beat technology. Journal of Scientific Exploration, 11(3), 263–274.
Carter, G. C., Knapp, C. H., & Nuttall, A. H. (1973). Estimation of the magnitude-squared coherence function via overlapped fast Fourier transform processing. IEEE Transactions on Audio and Electroacoustics, 21(4), 337–344. https://doi.org/10.1109/TAU.1973.1162496
Chaieb, L., Wilpert, E. C., Reber, T. P., & Fell, J. (2015). Auditory beat stimulation and its effects on cognition and mood states. Frontiers in Psychiatry, 6, 70. https://doi.org/10.3389/fpsyt.2015.00070
Garcia-Argibay, M., Santed, M. A., & Reales, J. M. (2019). Efficacy of binaural auditory beats in cognition, anxiety, and pain perception: A meta-analysis. Psychological Research, 83(2), 357–372. https://doi.org/10.1007/s00426-018-1066-8
Ingendoh, R. M., Posny, E. S., & Heine, A. (2023). Binaural beats to entrain the brain? A systematic review of the effects of binaural beat stimulation on brain oscillatory activity, and the implications for psychological research and intervention. PLOS ONE, 18(5), e0286023. https://doi.org/10.1371/journal.pone.0286023
International Telecommunication Union. (2015). Algorithms to measure audio programme loudness and true-peak audio level (Recommendation ITU-R BS.1770-4).
McConnell, P. A., Froeliger, B., Garland, E. L., Ives, J. C., & Sforzo, G. A. (2014). Auditory driving of the autonomic nervous system: Listening to theta-frequency binaural beats post-exercise increases parasympathetic activation and sympathetic withdrawal. Frontiers in Psychology, 5, 1248. https://doi.org/10.3389/fpsyg.2014.01248
McDonnell, W. M. (1983). Analysis and assessment of Gateway process [Memorandum]. US Army. CIA FOIA Electronic Reading Room, CIA-RDP96-00788R001700210016-5.
Monroe, R. A. (1975). Method of inducing and maintaining various stages of sleep in the human being (U.S. Patent No. 3,884,218). U.S. Patent and Trademark Office.
Monroe, R. A. (1993). Method of inducing mental, emotional and physical states of consciousness, including specific mental activity, in human beings (U.S. Patent No. 5,213,562). U.S. Patent and Trademark Office.
Monroe, R. A. (1994). Method of and apparatus for inducing desired states of consciousness (U.S. Patent No. 5,356,368). U.S. Patent and Trademark Office.
Orozco Perez, H. D., Dumas, G., & Lehmann, A. (2020). Binaural beats through the auditory pathway: From brainstem to connectivity patterns. eNeuro, 7(2), ENEURO.0232-19.2020. https://doi.org/10.1523/ENEURO.0232-19.2020
Oster, G. (1973). Auditory beats in the brain. Scientific American, 229(4), 94–102. https://doi.org/10.1038/scientificamerican1073-94
Sudre, S., Kronland-Martinet, R., Petit, L., Rozé, J., Ystad, S., & Aramaki, M. (2024). A new perspective on binaural beats: Investigating the effects of spatially moving sounds on human mental states. PLOS ONE, 19(7), e0306427. https://doi.org/10.1371/journal.pone.0306427
Reproducibility. The survey JSONs hold only derived frequencies, levels and statistics, never audio, so the analysis can be audited without the reference recordings.